

The information here is provided by courtesy of the Network's short online course - "An Introduction to Global Health".
Global Warming and Carbon Dioxide
The two You Tube videos below provide a quick summary of the position.
- What is Global Warming? (A straightforward account of what global warming is - 1.5 min.)
https://www.youtube.com/watch?v=YJrKgBUDGYc
- A Brief History of Global Warming (A rapid summary of the growing realisation of a problem – 3 min.)
https://www.youtube.com/watch?v=McRYTC56DC4
Global Warming : Global warming is happening because the burning of fossil fuels releases carbon dioxide (CO2) into the atmosphere and CO2 is a greenhouse gas. The industrial revolution started the increase in use of fossil fuels to drive machinery. Since the start of the industrial revolution atmospheric CO2 has steadily risen and now global temperatures are rising too.
CO2 Emissions : In 1750 global emissions of CO2 into the atmosphere were around, 9 million tons. A hundred years later in 1850 emissions had risen to around 200 million ton/years. By 1950 emissions had reached 5.3 billion tons/year and in 2017 they were 36 billion tons per year.
Most of this came from the combustion of coal. Oil started to became a major source towards the middle of the 20th century with gas contributing in the latter part of 20th century. (See Figures 1 and 2)
Figure 1

Figure 2

Atmospheric CO2 : Over the past 800,000 years, atmospheric CO2 levels have varied, but never risen above a 300 parts per million. In 1750 the level was just below 280 parts per million. Since then the level has risen rapidly and is now well over 400 parts per million. If things continue as they are, atmospheric carbon dioxide is projected to exceed 900 parts per million by the end of this century. (Figure 3)
Figure 3

Global Temperatures
Average global temperatures vary over time, but in 2019 the temperatures was 1 degree centigrade higher than pre-industrial levels and recent years have been the warmest on record. This takes us outside the range of average temperature experienced on Earth of the last 1000 years or so. (Figure 4).
Figure 4
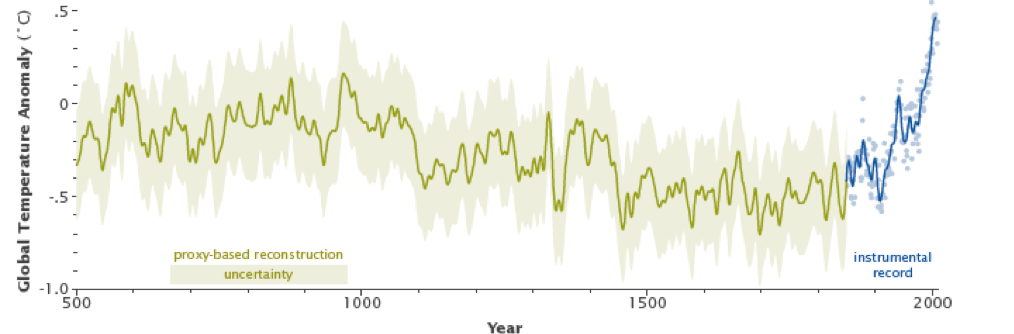
(Source : NASA Earth Observatory https://earthobservatory.nasa.gov/features/GlobalWarming/page3.php)
The rise in temperature has been particularly noticeable since the beginning in the early 1900s (Figure 5).
Figure 5

Even with the agreements that have been reached internationally about reducing carbon dioxide production, world temperatures are projected to rise to around 3 degrees centigrade above pre-industrial levels by the year 2100 (Figure 6).
Figure 6

Consequences
The consequences of this will be
- Rising sea levels leading to population migration
- More frequent and severe weather extremes e.g. droughts, floods and cyclones with consequent effects on people, their lives and livelihoods
- Ocean acidification with effects on sea life e.g. corals
- Extinction of some species
- Changing patterns of disease following changes in the distribution of disease vectors.
More will need to be done to reduce atmospheric carbon dioxide if we do not want these things to happen.
What can we do about it?
The simple answer is to reduce our use of fossil fuels.
Who will have to do something about it?
The the answer is mixed.
a) If you look at which countries contribute most, then Figure 7 suggests that the main players are China, other parts of Asia, the USA and the EU countries that need to do most.
Figure 7

b) If you look at how much we contribute individually, then Figure 8 suggests that individuals in the USA are the ones that could contribute most by reducing their consumption of fossil fuels.
Figure 8

Further reading
Greenhouse Gas, Wikipedia
https://en.wikipedia.org/wiki/Greenhouse_gas
Global Climate Change : Vital Signs of the Planet
https://climate.nasa.gov/vital-signs/global-temperature/
Our World in Data
https://ourworldindata.org/co2-and-other-greenhouse-gas-emissions
NASA
https://climate.nasa.gov/evidence/
NASA Earth Observatory
https://earthobservatory.nasa.gov/features/GlobalWarming/page3.php
Climate Change overview at WHO
https://www.who.int/health-topics/climate-change#tab=tab_1
WHO fact sheet on Climate Change about the overall impacts of climate change on health
https://www.who.int/news-room/fact-sheets/detail/climate-change-and-health
10 facts about Climate Change and Health
https://www.who.int/features/factfiles/climate_change/en/
Climate Change 2014 Synthesis Report Summary for Policymakers : Intergovernmental Panel on Climate Change
https://www.ipcc.ch/site/assets/uploads/2018/02/AR5_SYR_FINAL_SPM.pdf
Other reports by the IPCC
The United Nations Framework Convention on Climate Change
Sustainable Development Goal 13 : Action on Climate Change
https://sdgs.un.org/goals/goal13
Natural History Museum
The museum has produced a series of YouTube presentations entitle "Our Broken Planet" that examine a variety of topics related to sustainability and pollution.
https://www.youtube.com/playlist?list=PL6w4ihPqk5_JPPgFuU8duzfnhlyO0WRgo

